
Analytics is a module for reporting and data analysis in INEXTIA.
Reports are created in the module and then presented in Excel with graphs, tables, diagrams and the like.
The reports can then automatically be sent by e-amil via subscriptions.
Create analytics report
Before the data can be presented, it is necessary to create a report, so INEXTIA knows which data to include and how these should be displayed.
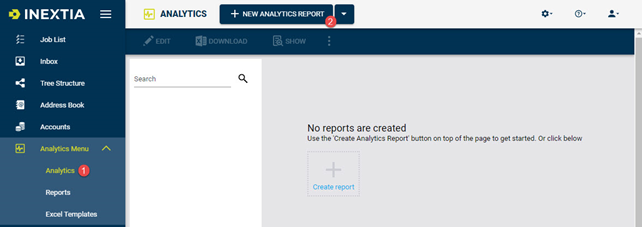
- Open the analytics screen.
- Click on “NEW ANALYTICS REPORT”.
Now select the template that the report should be based on.
In the following example, a report that shows a top 10 over the components that have had the most run-once jobs is created. This means that the report is based on job history data.
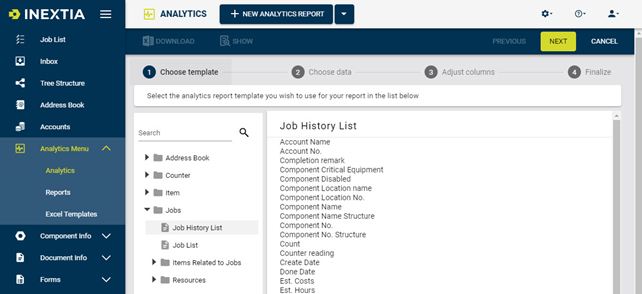
Click on “NEXT” after choosing the template.
Then choose the fields that you want to include in the report, by checking the boxes.
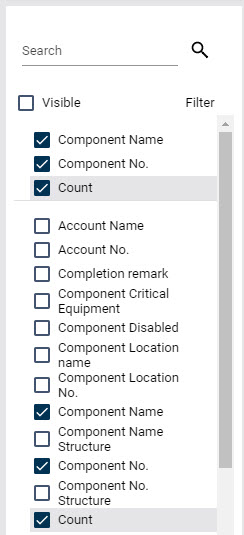
Please note that checked boxes will show in the top of the list.
A filter and other options can be set up at every field. In this example, we would like the report to show a top 10, therefor the following set up is made in the Count section.
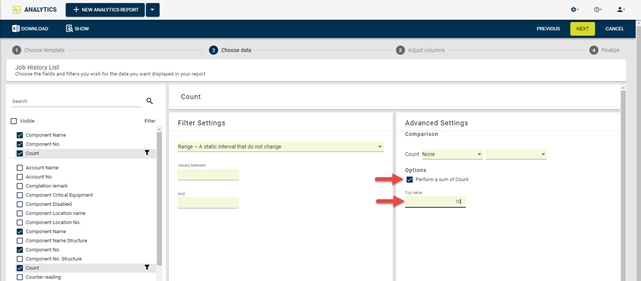
First, choose “Perform sum of Count”. This means that the data is grouped and the number is summed. Then type “10” in top value, which means that only those components where the sum of numbers is among the top 10 are displayed.
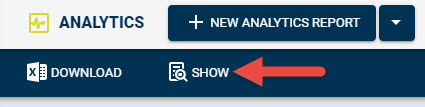
To see how the data will be displayed with the chosen fields and filters, click on “SHOW”.
A new tap will now open and show the data.
The data displays the 10 components that has the most registered Job histories. Job history on run-once jobs will only be included in this example and therefor a filter is applied to Trigger Type.
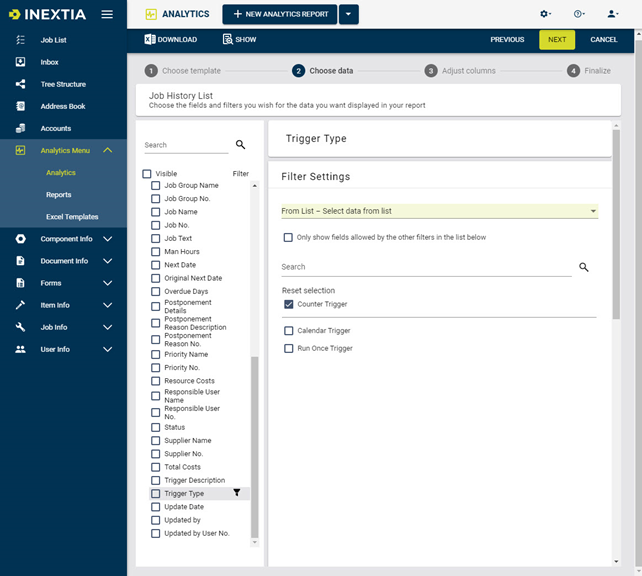
Please not that only one filter is applied on the Trigger Type. The field will not be displayed in the report.
Apart from the fact that run-once jobs are only included in this example, the job must be finalized as well. Therefore, another filter is applied to Status.
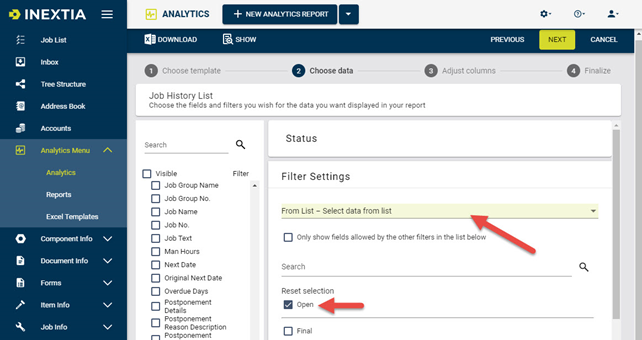
The status field is also not included in the report.
Based on what has been added to the example until now, a top 10 of the components that have had the most job history registration over time on run-once jobs will be displayed.
When only wanting to view the registrations within the last year, apply a filter to Done Date.
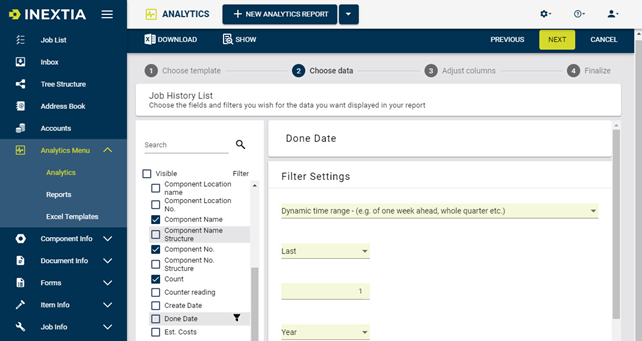
A dynamic time range is used in the example above. This means that the time range will change, depending on today’s date.
When the expected data is displayed (see data by pressing the "SHOW" button), click the "NEXT" button.
The following screen will now show where the placement of the columns can be changed.

Change the placement of the columns by clicking on the headers and dragging them to the desired spot. Then click the “NEXT” button.
As the last step, chose a name for the report and click on the “SAVE” button.
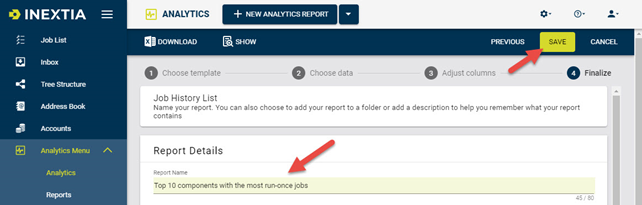
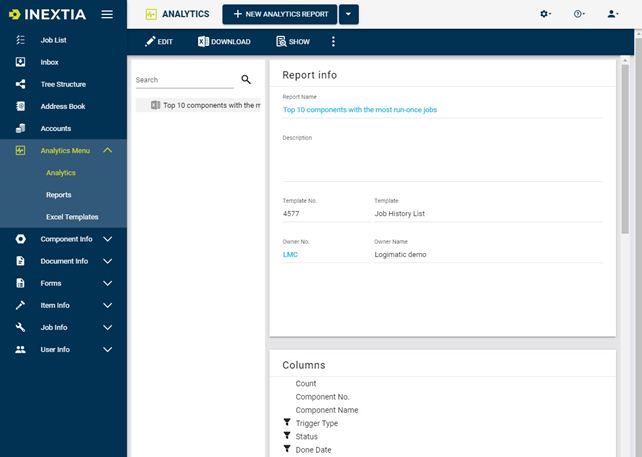
A report showing the components with the most run-once jobs is now saved.
The report will show on the Analytics front page.
From this page, the latest data can be displayed in Excel by clicking the “DOWNLOAD” button or in a new tap by clicking on the “SHOW” button.
Comments
0 comments
Article is closed for comments.